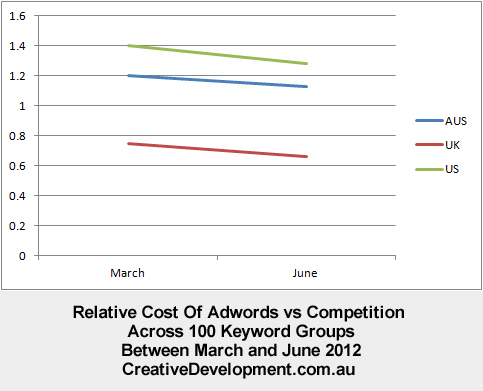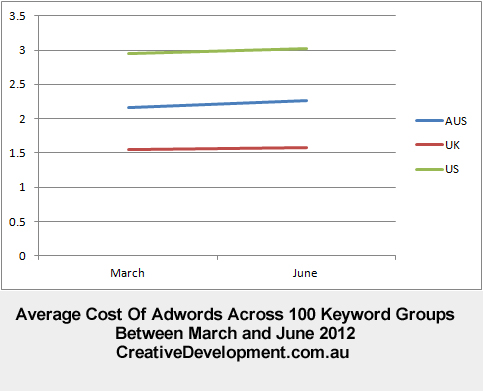
Every few months we look at the relative average cost of adwords for a range of over 100 keyword groups in the three major markets of the UK, the US and Australia. This month’s statistics can be found here. This month we updated our keywords to reflect broader changes in the market, which is why the graph above only shows the last two quarters. When we started this analysis, keywords like 3g mobile phone were commonly searched, and that was reflected in our data. Now that keyword has very few searches each month, so we had to updated the data.
Back in September 2010 we selected a range of keywords and used Google’s keyword tool to find out the average cost of each keyword, and the changes relative levels of competition for each keyword. Using that data we can build an average cost of those keywords and an average change in competition. The data also allows us to see if there has been any changes in the cost of advertising relative to the competition.
Generally, the CPC for each keyword is calculated as a function of advertiser’s bid, quality score and competition. We can assume that things like quality score will remain relatively the same across all competitions. As CPC bid and competition are connected (the more advertisers bid, the more the competition, the higher you have to bid to advertise) then the ratio of CPC to Competition should remain relatively the same. If more advertisers are bidding, there is an increased competition, and the average CPC should rise at a similar rate, and fall at a similar rate.
You can see from the graph above that over the last three months, the average CPC has remained the same. We have covered these changes several times in the past . The cost of advertising relative to competition, however, has fallen slightly.

This means that there has been an increase in competition across the three markets that is proportionally greater than the change in the cost of advertising. There are a few explanations for this;
- Advertisers have increased their quality score, or Google has changed the calculation
- Advertisers are willing to bid a lot less for each keyword
- Google has another, unspoken, component of the calculation, possibly called “Google’s Profit Target”
Obviously there are possible flaws in our data, and our assumptions, but the general idea should remain solid.
