Modern marketing methods allow you to track your ROI at every step of a campaign. Long story short, if you are not optimising your campaign for ROI, then you are probably throwing money down the drain. Google Analytics, and a range of other tools, allow you to calculate where you are making your money and what caused that to happen. There are three things you need to do first before you can really start looking at your ROI on SEO.
- Understand what the value of a sale is. If you are an ecommerce store, then that should be easy. If you are a service provider, that might be a little harder to quantify, but you should know what your average sale value is.
- Calculate what your profit margin is on an average sale
- Set up Google Analytics Goals or Ecommerce tracking (if you can) and give your goal value your average sale value.
This now allows you to carry out a wide range of analysis using Google Analytics. Generally there are three key ways to improve your ROI on SEO;
- Target keywords that generate more revenue
- Reduce your targeting on keywords that generate low revenue or a high exit/bounce rate
- Improve your landing pages and product offerings to encourage more people to buy
1. ROI on Keywords
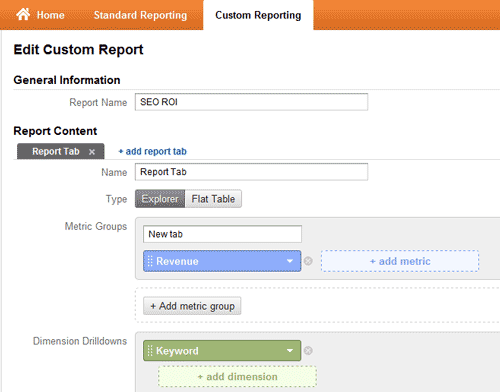
The number one ranking for a keyword might not get you the most number of sales. 10k queries for a product you never sell is almost a waste of time and money. This metric will allow you to track the value of the keywords that you are getting searched. Setting it up is straight foward. In Google Analytics follow these steps;
- Custom reporting
- New custom report
- Name: ROI on Keywords
- Metric Group: Revenue or Goal Completions
- Dimension Drilldown: Keyword
- Save
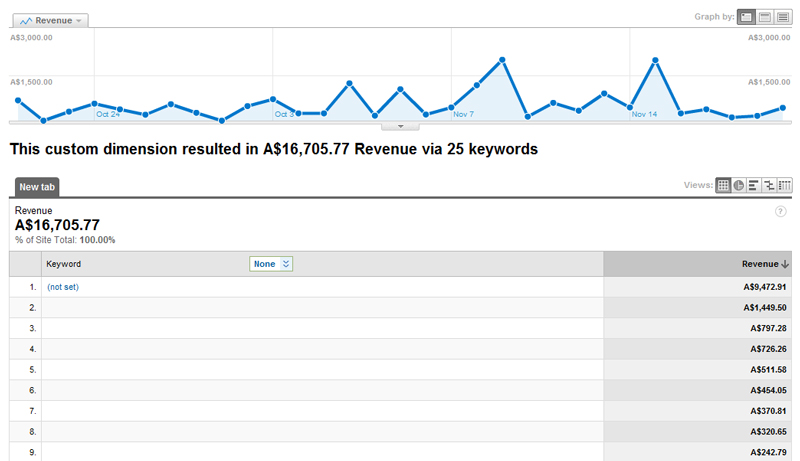
This should leave you with a view something like the information at the very top of this page.
One thing to remember about this is that as Google is now moving users to secure browsing, you will not get a complete set of results for the keyword metric, as this is not carried across with SSL.
This will then allow you to see which keywords are generating the goal completions or the ecommerce conversions for you. Whilst we do not recommend focussing ONLY on these keywords (as other un-ranked words might also generate sales for you), this is a good start to calculating your ROI.
2. Landing Page ROI
- Metric Group: Revenue or Goal Completions, and Pageviews
- Dimension Drilldown: Landing Page
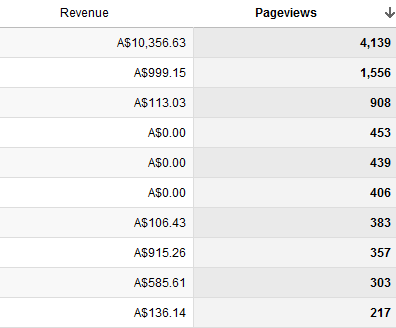
This will tell you which of the pages your customers have landed on before they completed a goal. This is probably the second most important metric after the keyword ROI. It will tell you if a page is ranking for you, generating pageviews, but not generating revenue. This then gives you three great options;
- Fix/change pages that are not generating any revenue for you
- Focus your SEO on pages that are generating revenue for you
- Change the keywords you are optimising for poorly performing pages
Your best performing page will probably be your front page. After that you should be able to see your top performing internal pages by revenue and pageviews. On the image to the right we have sorted by pageviews, and you can see there are three poorly performing pages there with a good number of views.
3. Keyword Bounce Rate
This metric will allow you to see all the keywords that are causing a high level of bounce rate. This means the keywords where people leave straight away. You could use the a secondary drilldown of “Landing Page” to see which pages with which keywords are causing you the most problems. Bounce rate is an issue because if people are leaving before they progress on your site, then they are either not finding what they are looking for, or they don’t find your website/product appealing.
You could also use the %exits metric to see the same examples of data for the number people that leave on that page/keyword.
To get a measurement that lets you improve your SEO ROI for this metric, you want to add the advanced segment of “Non-paid search traffic”.
All this data does is give you more ammunition for optimising your site for keywords that don’t make people leave straight away, or pages that look good enough to encourage people to buy.
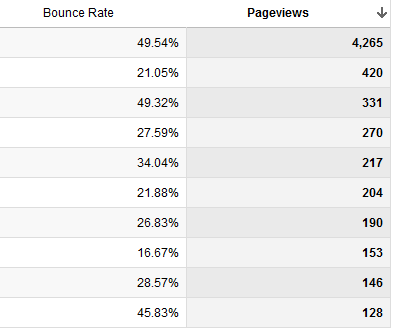
On the right we have sorted by the number of pageviews, and you can see there are some pages that are above our site average of 30% for bounce rate. One word of warning though, if you are testing your site’s position and have clicked through to your site a lot and then left, this will of course skew your results unless you have exluded your computer from search.
4. Keyword vs Exit Page
- Metric Groups: Exits
- Dimension Drilldown: Keyword and Exit Page
In an ideal world, you want to have all your visitors exit on your “Thankyou” page. This analysis will tell you which keywords are generating the largest number of exits and on what page. This means that if someone searches for your general term say “plumbers” and then gets to your page on “blocked drains” and exits, you can start to work improving the connection between that exit page and that keyword.
